
How to Count Unique Values in Excel? 3 Easy Ways to Count Unique and Distinct Values
(Note: This guide on how to freeze rows in Excel is suitable for all Excel versions including Office 365)
Working with large amounts of data in Excel can be quite difficult. Some values may be repeated more than once. You might have to take into account multiple entries of data while performing any function to upgrade your accuracy. You will also need to count the values to organize or even acquire statistics from the data.
With large data, it would be nearly impossible to count the values manually. Especially, keeping a track of unique or distinct values can be quite arduous. Fortunately in Excel, there are many ways to count unique and distinct values.
You’ll Learn:
First, let us understand the difference between Unique and Distinct Values.
Unique and Distinct Values
Data can be repeated or unrepeated. These unrepeated data are of two types. They are called unique data and distinct data.
Unique data are those which occur in the dataset only once.
Whereas, distinct data include the duplicate values but count them only once.
I will explain unique and distinct data with an example for better understanding.
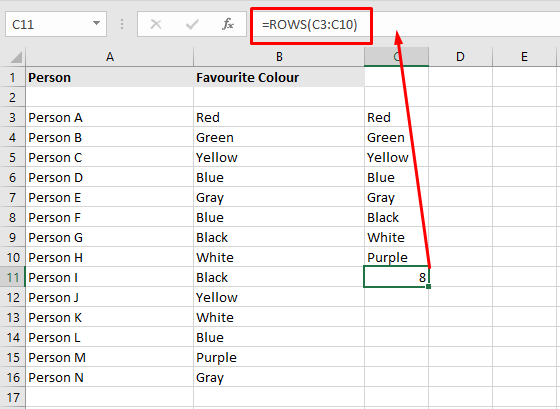
Consider an example, where column A has the list of people and column B lists their favorite colors.

In this, red, green, and purple colors occur only once, so they are called unique elements. Therefore the unique elements count is 3
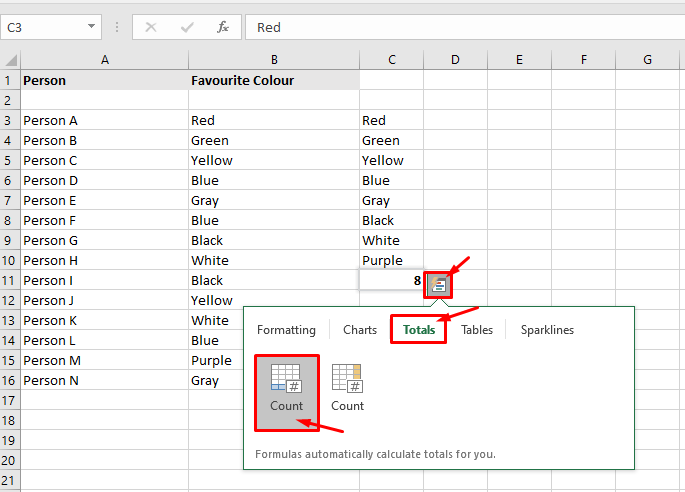
Whereas, there are 8 distinct elements. That is the colors, though repeated are counted once. The colors are red, green, yellow, blue, white, black, gray, and purple. So, the distinct value count is 8.

In this guide, I will show you how to count unique and distinct values in Excel.
Let’s dive in.
How to Count Unique Values in Excel
First, let us see how to count unique values in excel.
Using SUM, IF, and COUNTIF Functions
In Excel, functions are always available to solve any operations. In this case, you can use a combination of SUM, IF and COUNTIF functions to count unique values in Excel.
To count unique values, enter the formula =SUM(IF(COUNTIF(range, range)=1,1,0)) in the desired cell. The range denotes the starting cell and the ending cell.
This is an array formula where the count values are stored in a new array. Since this is an array formula, make sure you press Ctrl+Shift+Enter after entering the formula. Also, note that when you enter the formula, curly braces will automatically populate at the end of them. But, do not enter them manually.
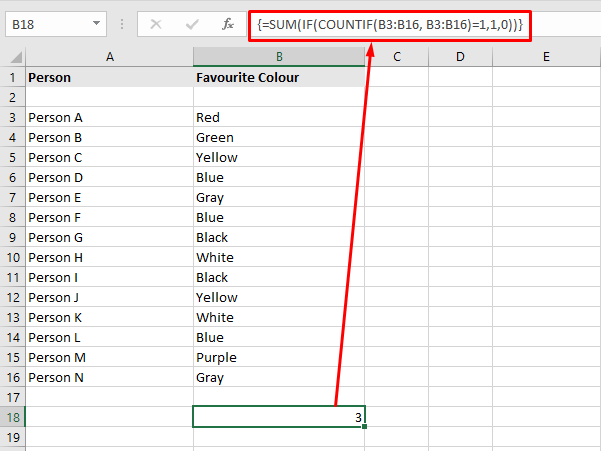
Consider the above example. To calculate the unique values in the given Excel sheet, enter the formula in the destination cell.
In the place of range, enter the cells which contain the elements whose unique value is to be found. Here, cells B3 to B16 house the said elements. So the formula becomes:
=SUM(IF(COUNTIF(B3:B16, B3:B16)=1,1,0))
Now, press Ctrl+Shift +Enter. This gives the count of unique values in the selected range. The unique value count is 3.
Simple, right? Now, let me explain how this formula gives the unique values in 3 simple steps.
- The COUNTIF function counts the number of unique values in the given range B3 to B16. That is the number of times the value is repeated in the range. These counted values are stored in an array. So, the array becomes [1,1,2,3,2,3,2,2,2,2,2,3,1,2]
- Then the IF function keeps the unique values(=1) and replaces anything other than 1 with 0. So the array becomes [1,1,0,0,0,0,0,0,0,0,0,0,1,0]
- Now finally, the SUM function adds the unique value and returns the value 3.
There are two additional cases while using the SUM, IF, and COUNTIF functions. You can use them to find either unique text values or numeric values in Excel.
Count Unique Text Values in Excel
In some tables and worksheets, some texts might be intertwined with numbers. In such cases, you can use the above-mentioned function with a little modification to find the unique text values in Excel.
Enter the formula =SUM(IF(ISTEXT(range)*COUNTIF(range,range)=1,1,0)) in the destination cell and press Ctrl+Shift+Enter. The range denotes the start and end cells that house the elements.
From the general formula, we have added the ISTEXT element to find the unique text values. If the value is a text, the ISTEXT function returns 1 and the value is counted in an array. If the cell houses a non-text value, it returns zero.
The functionality is also similar to the above common formula.
Count Unique Numeric values in Excel
This is a vice versa to the above-mentioned case. In case you only want to count unique numeric values intertwined with texts, you can use the below formula.
Enter the formula =SUM(IF(ISNUMBER(range)*COUNTIF(range,range)=1,1,0)) in the desired cell. The range denotes the start and end cells that hold the values.
Here, the ISNUMBER function returns 1 for numeric values and ignores other values. This function’s working is also similar to the above-mentioned case.
Note: In Excel, date and time are counted as numbers, so they are also counted.
We have seen how to count unique values in excel, we can also count distinct values by using the methods below.
How to Count Distinct Values in Excel
In Excel, there are two easy methods to find the number of distinct values.
Using Filter Option
This is an easy and simple method in Excel which gives you the unique values in your data. In this method, you can use the Filter option to pick out the distinct values. This option filters the elements to another row. then, you can use the ROWS function to find out the number of unique elements.
To find the unique rows using the Filter option, first select the rows/columns which have the duplicate elements.
Then, go to Data > Sort & Filter and click on Advanced.

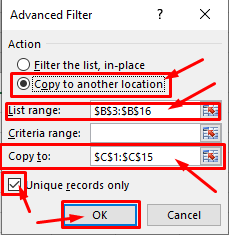
The Advanced Filter dialog box appears.
Specify the List range: i.e select the cells you need to apply the filter to. You can enter them manually, or click on the Collapse button ![]() , select the area and click Expand .
, select the area and click Expand .
First, select the Copy to another location. This copied the unique elements onto a new column.
Now, use the collapse and expand button to select the rows you want the unique elements to be copied.
Finally, check Unique records only. And click OK.
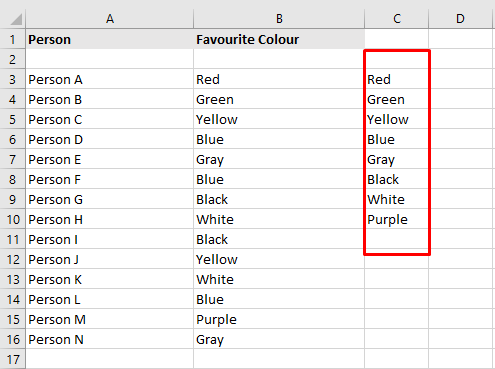
Thus the distinct elements are copied onto a new row.
To calculate the row count, you can select the columns and click on Quick analysis or Ctrl + Q. Select Totals and click on Row Count. This will give you the row count right below the unique elements.
Or, you can use the function =ROWS(a:b), where a and b are the starting and ending cells respectively.
Note: If you click on Filter the list, in-place, the selected values will be replaced in the same column.
Using SUM and COUNTIF functions
You can use the SUM and COUNTIF functions to calculate the distinct values in Excel. In this case, we will inverse the COUNTIF function to arrive at distinct values.
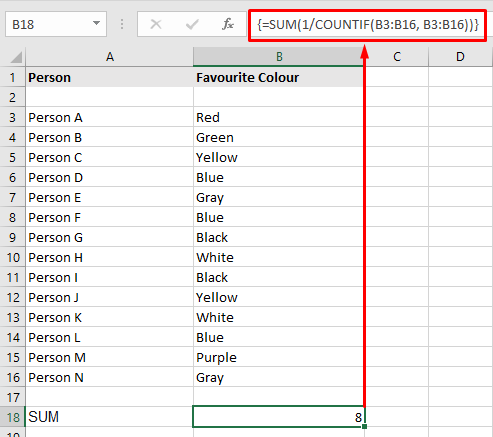
To count distinct values in excel, first enter the formula =SUM(1/COUNTIF(range, range)) in the desired cell. The range specifies the starting cell and ending cell separated by a colon. This is an array function, so press Ctrl+Shift+Enter to apply the formula.

Alternatively, you can also use the formula =SUMPRODUCT(1/COUNTIF(range, range)) in the desired cell to count distinct values. This is not an array function, so pressing Enter is sufficient to apply the formula.
Consider the same above-mentioned example. To count the distinct values, enter the formula =SUM(1/COUNTIF(B3:B16, B3:B16)) in the destination cell. Here, the range is B3:B16, so the values in cells B3 to B16 are taken into account.
First, the COUNTIF function counts the number of times the values occur in the given range. This value is stored in an array. Then, this value is divided by 1. So, if a value occurs twice, the value after dividing by 1 will be 0.5. Now, the SUM or SUMPRODUCT function adds up the fractional values and returns the result which is equal to the count of distinct values in the range.
Note: Similarly, you can also tweak the formulae a little to find distinct text values or distinct numeric values.
To find distinct text values: =SUM(IF(ISTEXT(range),1/COUNTIF(range, range),””))
To find distinct text values: =SUM(IF(ISNUMBER(range),1/COUNTIF(range, range),””))
Closing Thoughts
Finding the unique and distinct elements in a large dataset can be used to determine the statistics or probability of the data.
In this guide, we saw how to count unique and distinct values in Excel. Based on your specifications and preferences, you can either find the count of unique or distinct values.
If you need more high-quality Excel guides, please check out our free Excel resources center.
Simon Sez IT has been teaching Excel for over ten years. For a low, monthly fee you can get access to 100+ IT training courses. Click here for advanced Excel courses with in-depth training modules.
Simon Calder
Chris “Simon” Calder was working as a Project Manager in IT for one of Los Angeles’ most prestigious cultural institutions, LACMA.He taught himself to use Microsoft Project from a giant textbook and hated every moment of it. Online learning was in its infancy then, but he spotted an opportunity and made an online MS Project course - the rest, as they say, is history!
