Simon Sez IT

Online software training and video tutorials for Microsoft, Adobe & more

  • Course List
    • Adobe
      • Dreamweaver
        • Dreamweaver CC
        • Dreamweaver CS6
        • Dreamweaver CS5
        • Dreamweaver CS4
      • Flash
        • Flash CS5
      • InDesign
        • InDesign CS6
        • InDesign CS5
      • Photoshop
        • Photoshop CS6
        • Photoshop CS5
        • Adobe Photoshop CS4
      • Photoshop Elements
        • Photoshop Elements 2022
        • Photoshop Elements 2019
        • Photoshop Elements 2018
        • Photoshop Elements 15
        • Photoshop Elements 14
        • Photoshop Elements 13
        • Photoshop Elements 12
        • Photoshop Elements 11
        • Photoshop Elements 10
        • Photoshop Elements 9
        • Photoshop Elements 8
    • Microsoft
      • Access
        • Access 2019
        • Access 2019 Advanced
        • Access 2016
        • Access 2016 Advanced
        • Access 2013
        • Access 2013 Advanced
        • Access 2010
        • Access 2010 Advanced
        • Access 2007
      • Excel
        • Excel 2021 Advanced
        • Excel 2021 Intermediate
        • Excel 2021 Beginners
        • PivotTables for Beginners
        • Excel Dashboards
        • Advanced Formulas in Excel
        • Excel for Business Analysts
        • Advanced PivotTables
        • Power Pivot, Power Query and DAX in Excel
        • Excel 2019 Beginners (Mac)
        • Excel 2019 Beginners
        • Excel 2019 Advanced
        • Excel 2016 Beginners
        • Excel 2016 Intermediate
        • Excel 2016 Advanced
        • Excel 2013
        • Excel 2013 Advanced
        • Excel 2010 Beginners
        • Excel 2010 Advanced
        • Excel 2007
      • OneNote
        • OneNote Desktop and Windows 10
        • OneNote 2016
      • Outlook
        • Outlook 2019
        • Outlook 2016
        • Outlook 2013
        • Outlook 2010
        • Outlook 2007
      • Power Automate
        • Introduction to Power Automate
      • PowerPoint
        • PowerPoint 2021
        • PowerPoint 2019
        • PowerPoint 2016
        • PowerPoint 2013
        • PowerPoint 2010
        • PowerPoint 2007
      • Project
        • Project 2019
        • Project 2019 Advanced
        • Project 2016
        • Project 2016 Advanced
        • Project 2013
        • Project 2013 Advanced
        • Project 2010
        • Project 2010 Advanced
      • Publisher
        • Publisher 2013
      • SharePoint
        • SharePoint Online
        • SharePoint Foundation 2013
        • SharePoint Server 2013
        • SharePoint Foundation 2010
      • Teams
        • Microsoft Teams
      • VBA
        • Macros and VBA for Beginners
        • VBA for Excel
        • VBA Intermediate Training
      • Visio
        • Microsoft Visio 2019
        • Visio 2016
        • Visio 2013
        • Microsoft Visio 2010
      • Windows
        • Windows 11
        • Windows 10 (2020 Update)
        • Windows 10
        • Windows 8
        • Windows 7
        • Windows Vista
      • Word
        • Word 2019 Advanced
        • Word 2019
        • Word 2016
        • Word 2013
        • Word 2010
        • Word 2007
    • QuickBooks
      • QuickBooks
        • QuickBooks Desktop Pro 2022
        • QuickBooks Pro 2021
        • QuickBooks Online Advanced
        • QuickBooks Online
        • QuickBooks Canada
        • QuickBooks Pro 2020
        • QuickBooks 2019
        • QuickBooks 2018
        • QuickBooks Pro 2017
        • QuickBooks Pro 2016
        • QuickBooks Pro 2015
        • QuickBooks Pro 2014
        • QuickBooks Pro 2013
        • QuickBooks Pro 2012
        • QuickBooks Pro 2011
        • QuickBooks Pro 2010
        • QuickBooks Pro 2009
    • Web Development
      • AngularJs
        • AngularJS Crash Course
      • Dreamweaver
        • Dreamweaver CC
        • Dreamweaver CS6
        • Dreamweaver CS5
        • Dreamweaver CS4
      • Bootstrap
        • Bootstrap Framework
      • Html/CSS
        • HTML/CSS Crash Course
        • HTML5 Essentials
      • Python
        • Introduction to Python
      • Java
        • Java for Beginners
      • JavaScript
        • JavaScript for Beginners
        • jQuery Crash Course
      • MySql
        • MySQL for Beginners
      • PHP
        • PHP for Beginners
        • Advanced PHP Programming
      • XML
        • XML Crash Course
    • Data Analysis
      • Financial Modeling
        • Financial Forecasting and Modeling
      • Alteryx
        • Introduction to Alteryx
      • Power BI
        • Power BI – Beyond the Basics
        • Power BI
      • Qlik Sense
        • Qlik Sense
      • R Programming
        • R Programming
      • Tableau
        • Tableau Desktop Advanced
        • Tableau Desktop
      • Python
        • Introduction to Python
    • Work Productivity
      • Google Sheets
        • Google Sheets for Beginners
      • Confluence
        • Introduction to Confluence
      • Monday
        • Getting Started in Monday.com
      • Asana
        • Introduction to Asana
      • Jira
        • Getting Started in Jira
  • For Business
  • About Us
    • Testimonials
    • Contact Us
    • FAQ
    • Membership
    • About Us
  • Pricing
  • Free Resources
  • Sign In
  • Sign Up
Home > Microsoft Excel > How to Make a Box Plot Excel Chart? 2 Easy Ways

How to Make a Box Plot Excel Chart? 2 Easy Ways

Note: This tutorial on how to make a box plot Excel chart is suitable for all Excel versions including Office 365. 

In this guide, you will learn how to insert a box plot in Excel the easy way. 

I’ll cover:

  1. What is a Box Plot Excel Chart?
  2. How to Insert a box plot in Excel 2016 and 2019?
  3. How to Insert a box plot in Excel 2013?

Related:

Easily Make a Bullet Chart in Excel—2 Examples

Creating a Dynamic Pivot Chart Title Based on Slicer(6 Easy Steps)

How to Make a Line Graph in Excel? 4 Best Line Graph Examples

What Is a Box Plot Excel Chart?

A box plot helps you visualize the data distribution by displaying the minimum and maximum values along with their median and quartiles. 

Box Plot Excel Chart

Use them to :

  1. Find the average, median, and quartiles of the data
  2. Identify outliers in the data set
  3. Determine if the data is symmetric or skewed

They can be plotted both horizontally and vertically. 

How to Insert a Box Plot in Excel 2016 and Excel 2019? 

If you are using Excel versions 2016 or later, inserting a box plot is pretty straightforward. 

All you have to do is follow these simple steps:

  1. Arrange your dataset in a column. You can arrange it in descending order for your convenience and understanding. 
Box Plot Excel dataset
Box plot Excel chart’s dataset
  1. Select your data range and go to the Insert tab and click on the Insert Statistics chart icon under the Charts Group. 
Box and Whisker Plot Excel icon
Click on the Box and Whisker Plot Excel icon in the Charts group of the Insert tab
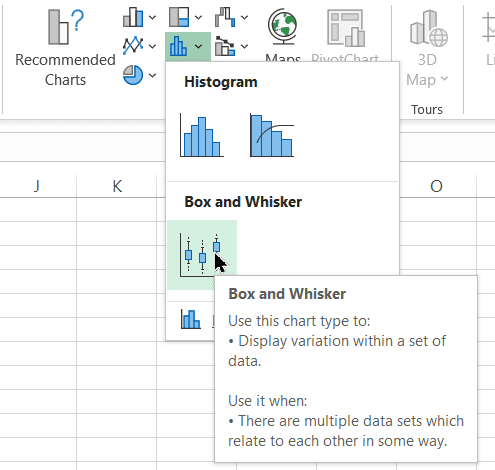
  1. Click on the Box and Whisker option.
Important elements in a Box and Whisker Plot Excel chart

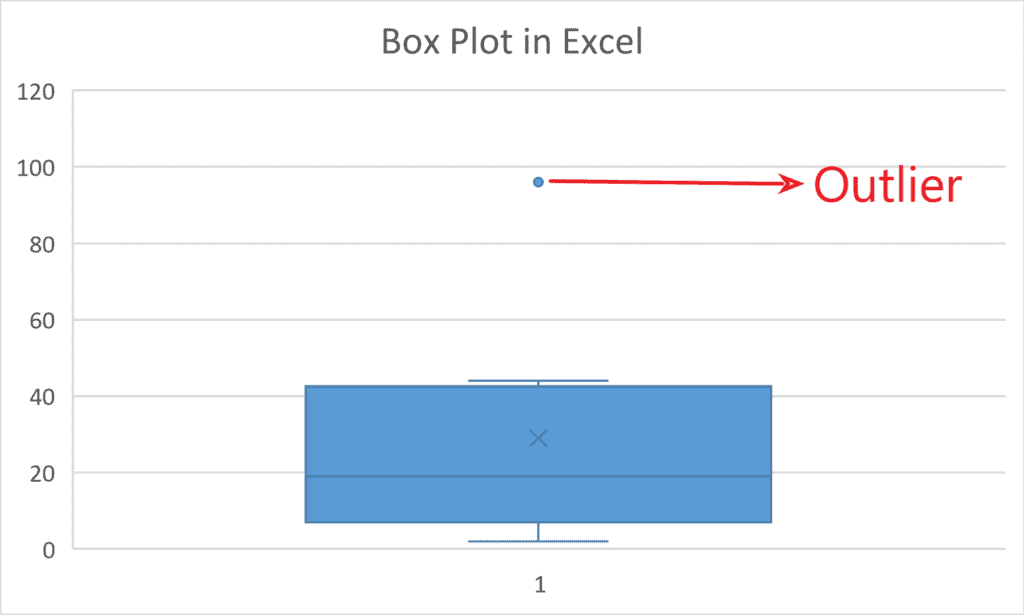
After that, your Excel box plot is ready. The middle line in the box plot is nothing but the median of the data set, which divides the data into two halves.  Also, the ‘x’ mark points to the average of the data set.

The bottom and the top parts of the box chart represent the 1st and 3rd quartiles respectively. Similarly, the vertical lines (whiskers) extend towards the bottom and top extreme values.

All outliers will lie beyond these whiskers. Outliers are nothing but data points that appear beyond a distance of 1.5 times the interquartile range before or after the first or the third quartiles (Q1&Q3).

Outlier in a box plot Excel chart

Also Read:

Bar Graph in Excel — All 4 Types Explained Easily (Excel Sheet Included)

How to Make a Scatter Plot in Excel? 4 Easy Steps

How to Add Error Bars in Excel? 7 Best Methods

How to Make a Box Plot in Excel 2013? 

It is still possible to insert a box plot in Excel 2013 and older versions. Follow these steps to do this easily. 

  1. Calculate the minimum, first quartile(Q1), median, last quartile(Q3), and maximum values of your data set. Do this using the MIN, QUARTILE, MEDIAN, QUARTILE, and MAX functions respectively. 
Calculate the Min, Q1, Median, Q3 and Max values
  1. In a separate column, calculate the length of the boxes as shown below:
    1. Hidden Box = Q1
    2. Lower Box = Median – Q1
    3. Upper Box = Q3 – Median
    4. Top Whisker = Max – Q3
    5. Bottom Whisker = Q1 – Min
  1. Now, select the calculated values of the first three boxes (hidden, lower and upper) and click on the Stacked Column chart option under the Charts group of the Insert tab. 
  1. Click on the bottom-most column and set the fill to No Fill. Similarly, set the border to no border in the Format Data Series pane. Finally, remove the legend and other unnecessary chart elements. 
Set No Fill to the Hidden box in the chart
  1. To add the top whisker, click on the topmost box and go to the Chart Elements menu and choose Error bars. Under the Error bars options set the direction to ‘Plus’ and click on the Custom option to specify a value. Now, select the cell which contains the value of the top whisker. 
Add Whiskers to Box Plot Excel using Error bars
Click on the More options button in the Error bars menu under the Chart elements section
Set top Whisker Width
Choose ‘Plus’ under direction and click on the Specify value button to link the cell which contains the top whisker’s width
  1. Follow the same procedure to add the bottom whisker but click on the hidden box instead and select the cell which contains the value of the bottom whisker in the specify value menu. 
Add Bottom Whisker to Box plot in Excel
Choose ‘Minus’ under direction and click on the Specify value button to link the cell which contains the bottom whisker’s width
  1. Adjust the fill colours and formatting of the stacked column chart to closely resemble a box plot. 
  1. You can add an average marker to the box plot by pasting the average value as a new data series to the same stacked column chart. Just remember to format it as a Line with Markers and later change the line’s fill to No fill. 

    Follow these steps:

    1. Copy the calculated average value, click on the box plot Excel chart and click on the Paste as special button in the Home tab.
Box Chart
Copy the average value, select the Box chart and Click on the Paste as Special button

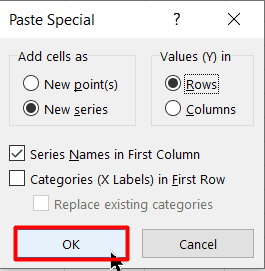
2. In the Paste Special dialogue box, tick ‘New Series‘, ‘Series Name in First Column‘ and Plot values (Y) in rows and click OK.

Box Plot Add Average
Use Paste Special to plot the average inside the Box Plot Excel chart

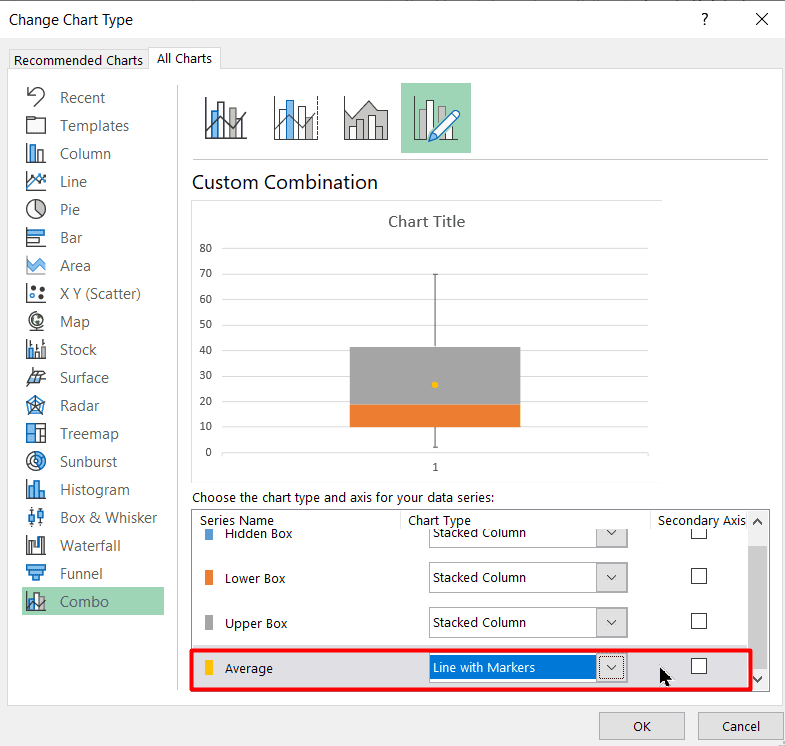
3. Now, the average value will be plotted as another stacked column. You need to change this to a marker instead. To do this, right-click on it and choose the Change series chart type option. Then, in the Change chart type menu, change the chart type of the average to Line with Markers. Now, the average of the data series will appear inside the Excel box plot. In case, a line appears double click on the line and set its fill to No Fill in the format data series pane.

Plot the average inside the Excel box plot
Right-click on the Average stacked column and choose the Change Series Chart Type option
Plot Average as line with markers
Set the Chart Type of the Average data series to Line with Markers and click OK.
Box plot in Excel using Stacked Column chart

Suggested Reads:

How to Add a Watermark in Excel? 2 Easy Methods

How to Remove Hyperlinks in Excel? 3 Easy Methods

How to Use the Format Painter Excel Feature? — 3 Bonus Tips

Closing Thoughts

That’s all folks. In this guide, I have shown you the two easiest ways to make a box plot Excel chart. Try them out now in a practice Excel sheet to understand the concept better. 

If you have any questions about this or any other Excel feature please let us know in the comments section. We’re always happy to help. 

Want more high-quality guides for Excel? Check out our free Excel resources centre. 

Click here to access in-depth Excel training courses and master in-demand advanced Excel skills. 

Simon Sez IT has been teaching critical IT software for over ten years. For a low, monthly fee you can get access to 100+ IT training courses by seasoned professionals.

Simon Calder

Chris “Simon” Calder was working as a Project Manager in IT for one of Los Angeles’ most prestigious cultural institutions, LACMA. He taught himself to use Microsoft Project from a giant textbook and hated every moment of it. Online learning was in its infancy then, but he spotted an opportunity and made an online MS Project course - the rest, as they say, is history!

30 day vertical banner

Most Popular Posts

  • How to Insert a Checkbox in Excel? 3 EASY Examples
  • How to Autofit Excel Cells? 3 Best Methods
  • XLOOKUP Google Sheets – 4 Best Alternatives!
  • Dashboards in Excel Using Pivot Tables, Pivot Charts and Slicers
  • Free Microsoft Project Training Course
  • Free Microsoft Access Tutorial for Beginners (3.5 Hours Video)
  • How to Use Blending Mode With Layers in Adobe Photoshop Elements 15
  • How to Create Charts and Graphs in Microsoft Excel 2016

Similar Posts

Microsoft Project 2019: Linking Tasks and Dependencies

Battle of the Excel Lookup Functions: VLOOKUP vs INDEX/MATCH vs XLOOKUP

How to Setup Appointments and Meetings in Microsoft Outlook 2013

How to Use Instant Fix with Photoshop Elements 2019 Organizer

Subtasks and Summary Tasks in Microsoft Project

Working with Long Documents in Word 2013

Course Categories

  • Web Development
  • QuickBooks
  • Microsoft
  • Adobe
  • Data Analysis

About Us

  • About Us
  • Free Resources
  • Affiliates
  • Become an Instructor

Products

  • Pricing and Plans
  • Business Pricing
  • Government Discounts
  • Non-Profit Discounts

Support

  • FAQ’s
  • Contact Us
  • DVD support

Connect

YoutubeFacebook
© 2022 Simon Sez IT, Inc.
  • Terms
  • Privacy Policy
888.817.6665 Monday thru Friday 7:30 a.m. - 5:00 p.m. (ET)