
Create an Excel Dashboard in 5 Minutes – The Best Guide
This Excel Dashboard tutorial is suitable for users of Excel 2013/2016/2019 and Microsoft 365.
Objective
Create a simple interactive Excel dashboard to display critical metrics in 5 minutes.
This Guide Covers:
Excel Dashboards Explained
Have you ever wondered how all those dynamic dashboards with eye-catching graphs and pie-charts that turn heads and receive applause from your co-workers are created?
Did you scramble all over the internet just to find that one article that clearly explains how to create Excel dashboards without wasting your time with unwanted information?
Look no further! You have come to the right place.
What we have here is a short and to the point guide on how to implement interactive dashboards in Excel in just 5 minutes.
Still, wondering? Read on…
An interactive Excel dashboard is a data management tool that harnesses the power of Excel data analysis tools such as Pivot Tables and Pivot Charts to track, analyze, monitor, and display key business metrics. In an interactive Excel dashboard, data becomes visually meaningful, and with tools such as slicers, users can interact with the data enabling them to derive important insights and make data-driven well-informed business decisions.
Related:
Dashboards In Excel Using Pivot Tables, Pivot Charts And Slicers
Excel Templates For More Efficient Project Management
Easily Make a Bullet Chart in Excel—1 Bonus Video Included
Excel dashboards can be simple or complex, and there is no right or wrong way to design an Excel dashboard. Get creative and tell the story of your data!
Creating Excel dashboards can be quite challenging at first, especially for new users.
Don’t worry, we’re here to help.
In this post, we will show you how to easily create an Excel dashboard, using Pivot Charts in just 5 minutes. To do this, we will be making certain assumptions; you are familiar with Excel, and you are familiar with creating Pivot Tables and Pivot Charts.
VIDEO TUTORIAL – EXCEL DASHBOARD
Create an Excel Dashboard in 8 Simple Steps
This is our step by step approach to easily create Excel Dashboards. Try them out in your dashboard template or workbook to gain familiarity.
- Start with a Clean Dataset
- Format data as a Table
- Create the first Pivot table and Pivot Charts
- Create Multiple Pivot table and Pivot Charts for other variables
- Assemble the Excel dashboard
- Add Slicers & Timelines
- Connect Slicers to data
- Update the Excel Dashboard
Let’s jump right into these steps and see how things are done in more detail.
Start with a Clean Dataset
You must start with a clean dataset before analyzing it with a Pivot Table or Pivot Chart. If your dataset is imported, you may get errors and inconsistencies that need fixing before you start. Click here to see the Top Ten Ways to Clean Data in Excel.
Format as a Table
If you plan on updating or adding more information to your dataset, you need to put your data in an Excel table before analyzing it. Tables can auto-expand and accommodate any new data. You can then ensure Pivot Tables, and Pivot Charts created, update with just one click.
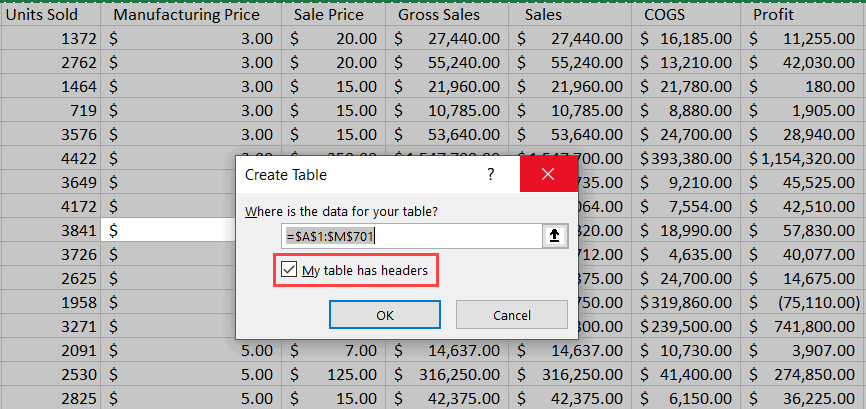
- CTRL+A to select the entire dataset
- CTRL+T to create a table
- Select My table has headers
- Click OK
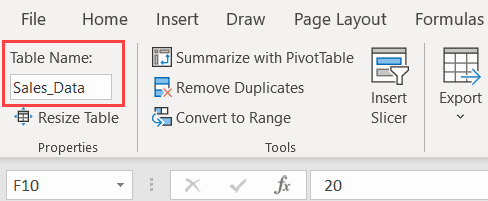
- Give the table a meaningful name, ensuring that there are no spaces in the table name.
Create the first Pivot Table and Pivot Chart
It is time to create the first Pivot Table and Pivot Chart for the dashboard.
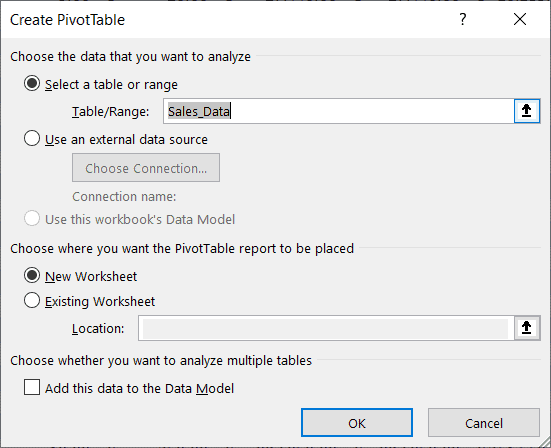
- From the Table Design tab, click Summarize with Pivot Table
- Check that the PivotTable uses the correct source data, in this case, the table name, and select the option to create the Pivot Table on a New Worksheet.
- Arrange the Pivot Table fields as required.
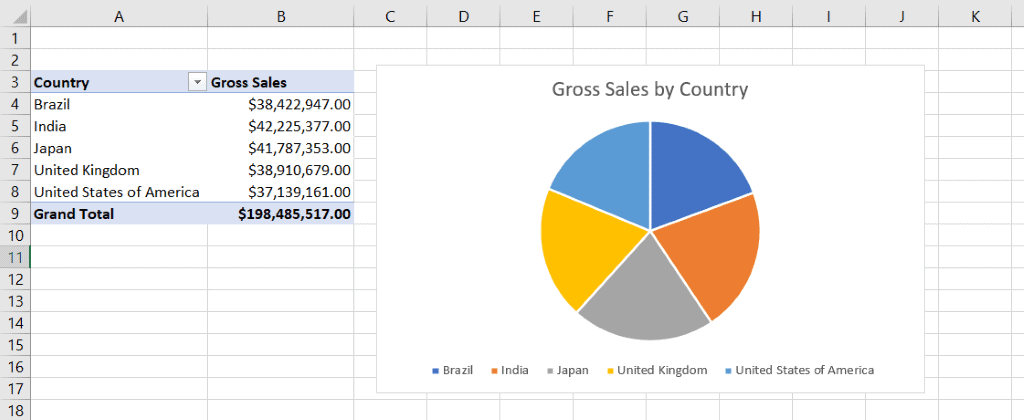
In this example, I want to see the Total Gross Sales for all Countries.

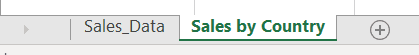
- Name the worksheet tab so it is easy to identify.
- Click in the Pivot Table and create a Pivot Chart on the same worksheet
In this example, I have created a Pie Chart. I have also added a chart title, moved the legend to the bottom, and all field buttons are hidden.
Also Read:
Getting Started With 3d Maps In Excel
Microsoft Teams Tutorial – Getting Started.
Pivot Table In Excel, How Do You Create One?
Create multiple Pivot Tables and Pivot Charts
We have one Pivot Chart ready to place on our Excel dashboard. We need to create more to display those vital key metrics. You can create additional Pivot Tables quickly by copying the current worksheet.
- Hold down the CTRL key.
- Click on the current worksheet and drag it to the right to make a copy.
- Delete the Pie Chart.
- Re-arrange the Pivot Table fields to display the next key metric.
- Rename the worksheet tab to make it easy to identify.
- Repeat this process of creating new worksheets, Pivot Tables, and Pivot Charts until you have all the key metrics you want to display on the Excel dashboard.
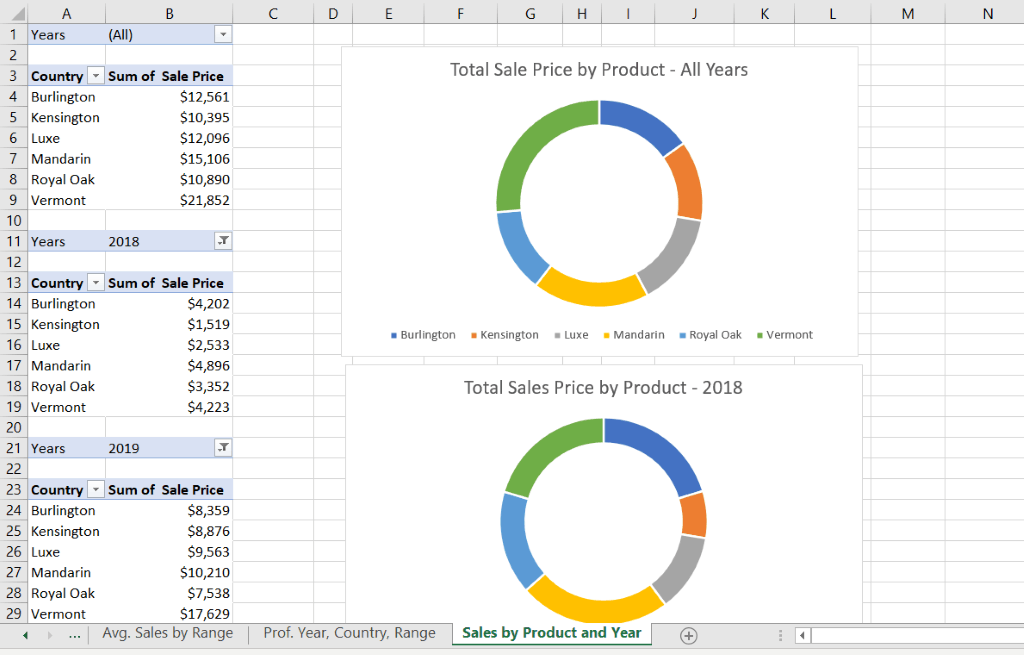
In the example below, I have created three Pivot Tables and three doughnut charts on the same worksheet to display the total sale price by-product for 2018, 2019, and both years.
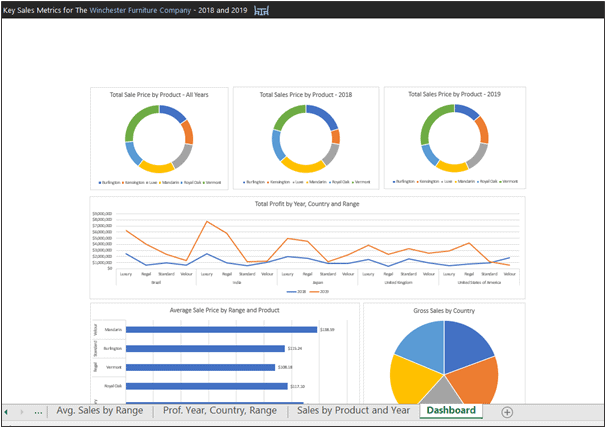
Assembling the Excel Dashboard
After you have created all the Pivot Tables and Pivot Charts, you can now assemble the Excel dashboard.
- Create a new worksheet and name its ‘Dashboard’.
You can design an Excel dashboard however you please. If you are struggling for inspiration, Pinterest is a good source for ideas relating to Interactive Dashboard Design.
- Copy the Pivot Charts from the other worksheets, and Paste them on to the dashboard.
- Arrange them so they look neat.
Adding Slicers and Timelines
You can add filters in the form of Slicers and Timelines to a dashboard in Excel. These help users interact with the Excel dashboard and view it in different ways. You can add one or more slicers to a dashboard to filter the data.
Adding Slicers
- Click on any one of the Pivot Charts
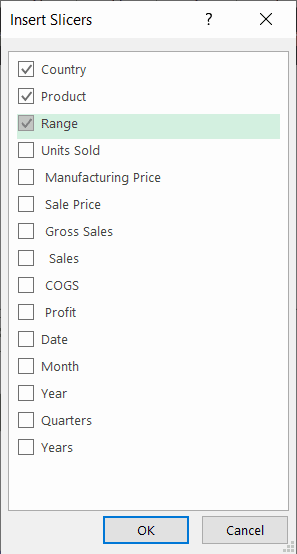
- From the PivotTable Analyze tab, in the Filter group, select Insert Slicer
- Select the fields you want to filter by
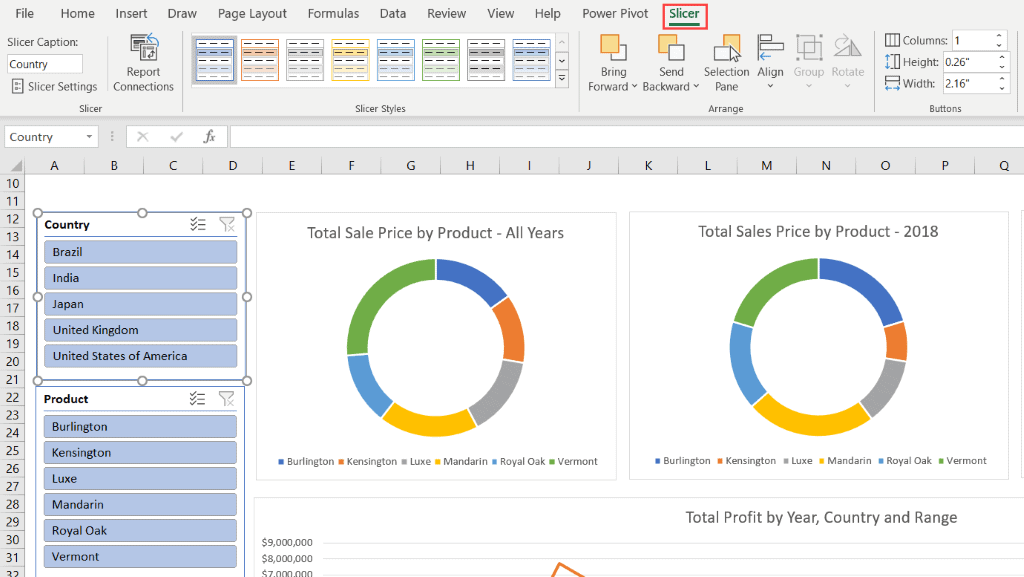
- Position the slicers on the dashboard
- You can utilize the Slicer tab to format the slicers
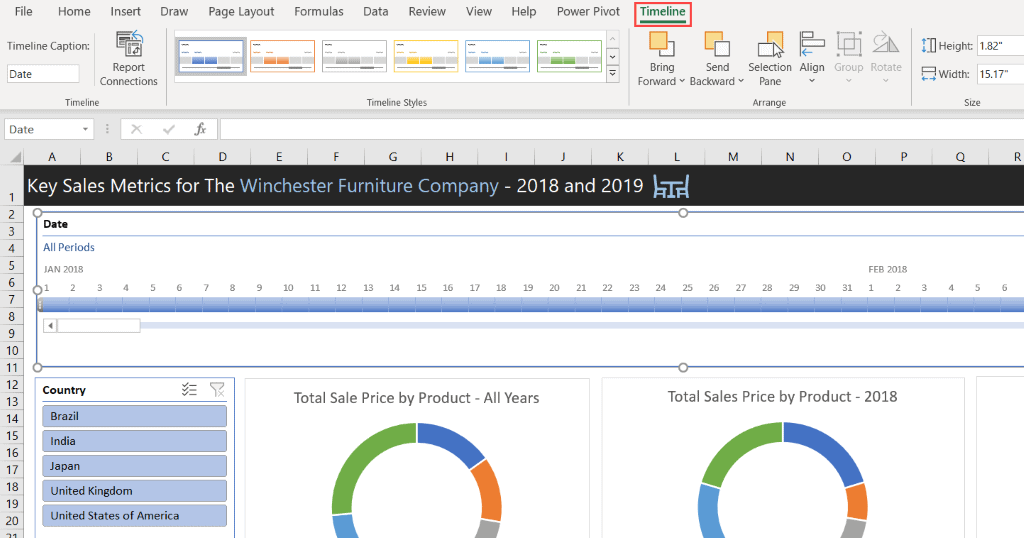
Adding Timelines
A Timeline is a slicer specifically for date fields. Therefore, it is essential to format your date columns in your dataset in the date format.
- Click on any one of the Pivot Charts.
- From the PivotTable Analyze tab, in the Filter group, select Insert Timeline.
- Select the date field you want to filter by.
- Position the Timeline on the Excel dashboard.
Connecting Slicers
To insert a slicer or a timeline, you must select a Pivot Chart. However, this means that the slicer only connects to that Pivot Chart. To control all the Pivot Charts, you will need to join the slicer to everything on the Excel dashboard.
- Right-click on the Slicer.
- Select Report Connections.
- Select all the Pivot Charts to connect the slicer to.
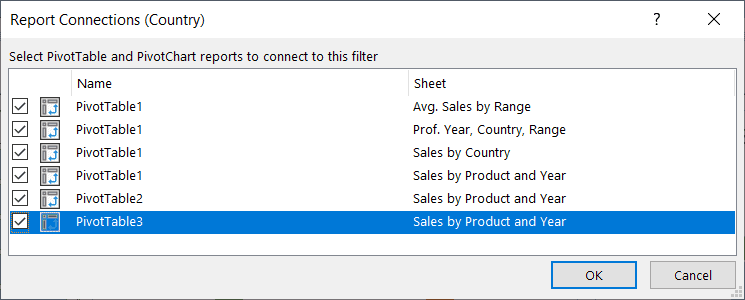
- Repeat this process for all Slicers.
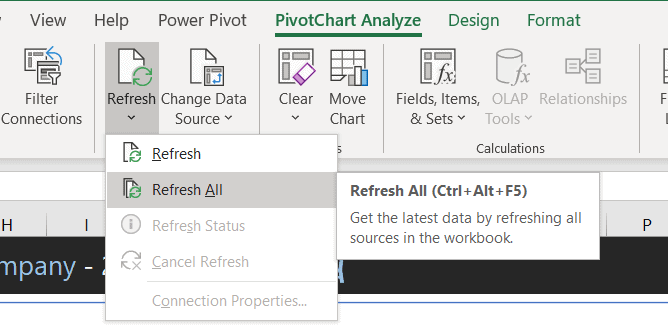
Updating the Excel Dashboard
Datasets rarely remain static. They are continually updated with new data. The process of updating everything on the Excel dashboard to include the new data is simple if you put your dataset into a table before creating the Pivot Tables.
- Add the new data into the dataset
- On the dashboard, click on a Pivot Chart
- From the PivotChart Analyze tab, in the Data group, click Refresh All
Latest Posts
- Top 20 Excel Efficiency Hacks to Improve Productivity (1-Hour Recorded Webinar)
- How to Lock a Row in Excel? 4 Useful Ways
- How to Subtract in Excel?- 4 Different Scenarios
- How to Create Table of Contents in Word? A Simple Guide
- How to Add a Column in Excel? 3 Effective Ways
FAQs
How do I share an Interactive Excel Dashboard?
You can share the workbook that contains the Interactive Excel Dashboard by clicking on the share button on the top right-hand corner of the Excel window. You can then either send them the workbook directly or just share a link to it.
Are Pivot Charts updated automatically in Excel?
Yes, pivot charts are updated automatically in Excel whenever the original data is altered. You can still refresh them just to make sure.
Creating an Excel Dashboard – Let’s Wrap up
That is how you create a basic Excel Dashboard in 5 minutes! Of course, dashboards in Excel can get extremely complex and include more than just Pivot Charts, so it is worth doing your research. We can dive deep into more applications and shortcuts for interactive Excel Dashboards later. But for now, let’s master creating Excel dashboards quickly. The most important point here is PRACTICE, PRACTICE and PRACTICE!
For more information on creating interactive Excel dashboards, please check out the following links:
Excelfind – Ultimate Excel Dashboard | Basic Interactive Dashboard
EDUCBA – 10 Useful Steps to Create Interactive Excel Dashboards
You might also like these free tutorials from Simon Sez IT
- Creating a Dynamic Pivot Chart Title Using Splicers
- Designing Better Spreadsheets in Excel
- Pivot Charts in Excel
For more high-quality and informative guides on Excel check out the full range of Excel courses from Simon Sez IT.
Deborah Ashby
Deborah Ashby is a TAP Accredited IT Trainer, specializing in the design, delivery, and facilitation of Microsoft courses both online and in the classroom.She has over 11 years of IT Training Experience and 24 years in the IT Industry. To date, she's trained over 10,000 people in the UK and overseas at companies such as HMRC, the Metropolitan Police, Parliament, SKY, Microsoft, Kew Gardens, Norton Rose Fulbright LLP.She's a qualified MOS Master for 2010, 2013, and 2016 editions of Microsoft Office and is COLF and TAP Accredited and a member of The British Learning Institute.
